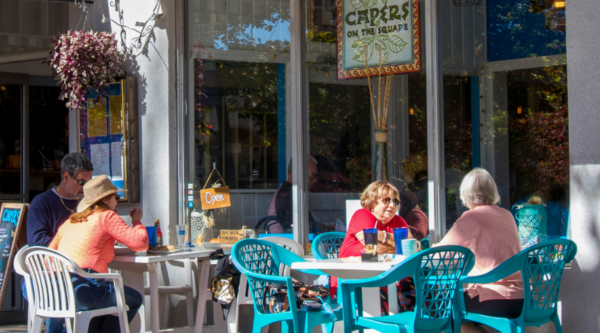
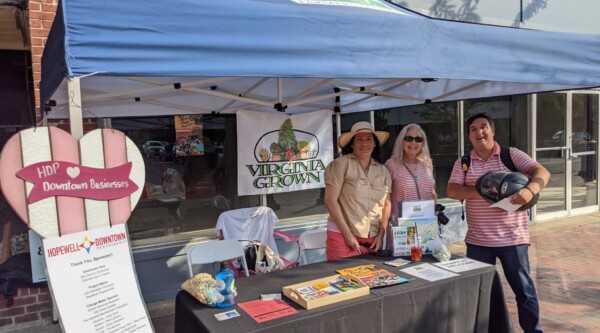
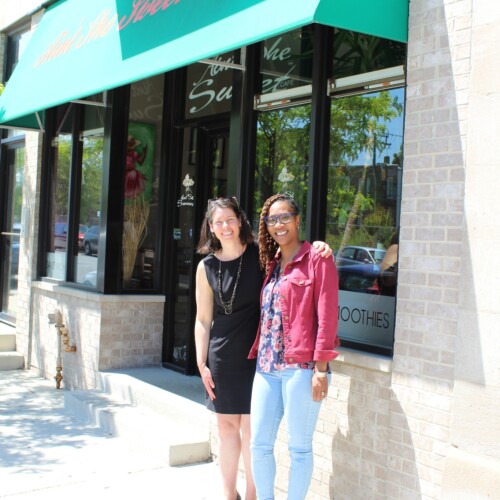
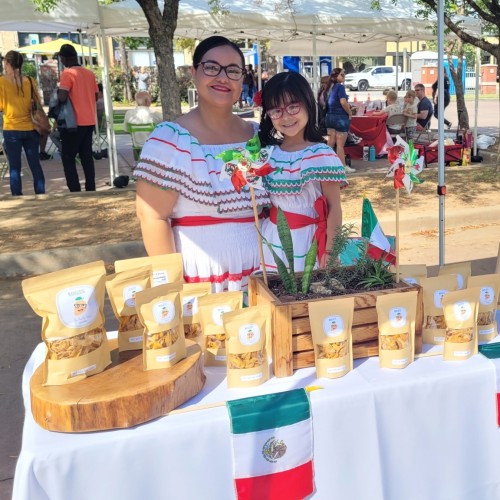
We work in collaboration with thousands of local partners and grassroots leaders across the nation who share our commitment to advancing shared prosperity, creating resilient economies, and improving quality of life.
Made up of small towns, mid-sized communities, and urban commercial districts, the thousands of organizations, individuals, volunteers, and local leaders that make up Main Street America™ represent the broad diversity that makes this country so unique.
Looking for strategies and tools to support you in your work? Delve into the Main Street Resource Center and explore a wide range of resources including our extensive Knowledge Hub, professional development opportunities, field service offerings, advocacy support, and more!
Join us in our work to advance shared prosperity, create strong economies, and improve quality of life in downtowns and neighborhood commercial districts.
Main Spotlight: Insights from the 2023 Trends Survey
In January, the Main Street America research team launched our latest Main Street Trends Survey focused on understanding the landscape of local Main Street programs operating around the country. The 2023 Trends survey represents the 15th Trends Survey conducted by MSA since 2005, and the first since May of 2021.
We received 367 completed surveys from Main Street leaders in 41 states. To incentivize participation, we decided to offer a free conference registration to one local program leader who submitted a completed survey and to one coordinating program that had at least 50 percent of their accredited and affiliate programs represented. Congratulations to lucky Louisiana, where Winnsboro Main Street in Winnsboro, Louisiana was randomly selected for a free Main Street Now registration, as was the Louisiana Coordinating Program!
We created a series of visualizations and takeaways that summarize the highlights of the 2023 results. A complete version of the results is available here. Do these trends match up with your experiences at the local level?
Main Street Programs’ Legal Structures and Annual Budgets
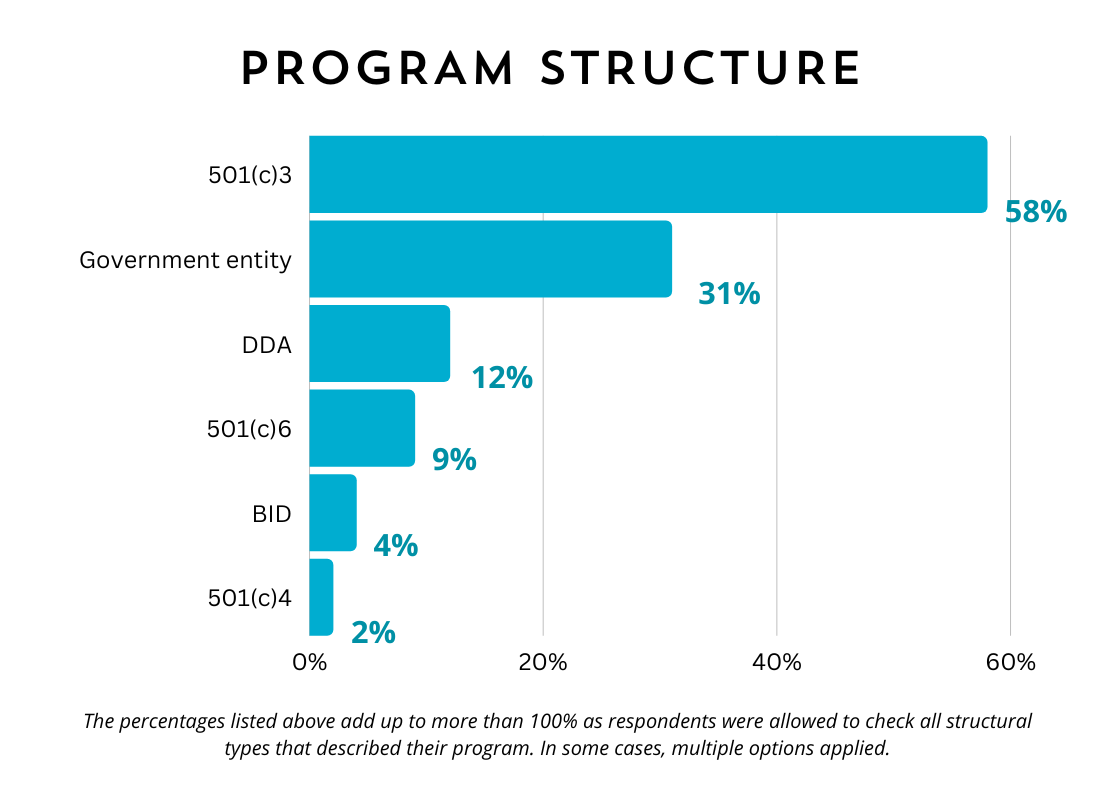
The Trends survey offers the best data available on how local Main Street programs are structured. The 2023 Trends survey data indicates that 58 percent of Main Street programs are 501(c)3 nonprofit organizations. Government entities were the next most common form at 31 percent.
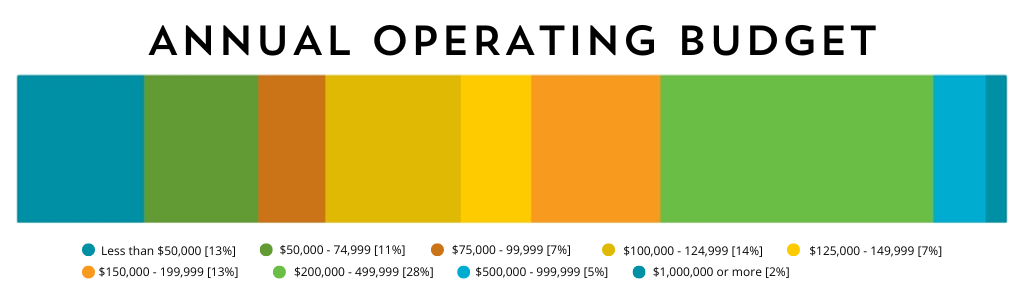
The Trends survey is also the best source of information on local Main Street programs’ annual budgets. In the 2023 Trends survey, we see that programs are roughly evenly distributed in three groups: those with annual budgets of less than $100,000 (31%), between $100,000 and $200,000 (34%), and more than $200,000 (35%). 28 percent of local programs indicated that they have an annual budget between $200,000 and $500,000—the most common response to this question.
Executive directors indicated a diverse variety of sources of funding, including public funding, revenue, grants, and other sources.
Public funding from local governments was the most common source by a wide margin. 88 percent of respondents indicated that they receive some public funding from their city or county. Half of all respondents said they receive 50 percent or more of their budget from local government, and 12 percent—about one in eight programs—receives their entire budget from their local government.
Event or festival revenuefrom visitors and vendors was the next most common source of budget dollars. 62 percent of local programs indicated that some portion of their budget comes from events and festivals. In contrast to public dollars from local governments, however, events rarely represent a major source of revenue. Only 6 percent of respondents said events revenue represents 50 percent or more of their budget.
Several other sources of budget revenue were frequently cited, including grants (46%); sponsorship from companies, philanthropy, public entities, etc. (46%); donations (39%), other earned revenue from product sales, business ventures, etc. (29%); annual investor or supporter campaigns (25%); and membership dues (24%), among other sources.
The variety and diversity of funding sources is noteworthy. Only 14 percent of respondents had a sole source of revenue for their annual budgets, and only 25 percent had one or two sources. 55 percent of all respondents listed at least four different sources of revenue for their annual budgets, and 20 percent listed six or more sources.
We asked Main Street leaders about how programs’ annual budgets have changed over the past two years. In this year’s survey, we see that nearly nine out of ten Main Street programs have stable or growing annual operating budgets. 88 percent of respondents indicated either that their annual budget had stayed about the same or had increased. Only 9 percent said they had their budget had been diminished by 5 percent or more since the previous year.
We find a similar story in terms of the public-private mix of funding in programs’ annual budgets. 78 percent of programs reported either that their public-private balance of funding had not changed since the previous year or that both public and private sources of revenue had increased.
Main Street Staffing, Salaries, and Benefits
Main Street organizations continue to operate with very few paid staff but many volunteers. Most Main Street programs have one full-time staff person (63%), zero or one part-time staff person (81%), and zero or one temporary staff or contractors (76%). The survey data also indicates that most local organizations (57%) have 20 volunteers or more. Across our survey respondents, local Main Street programs have an average of 46 volunteers who contribute at least 3-5 hours of their time over the course of a year.
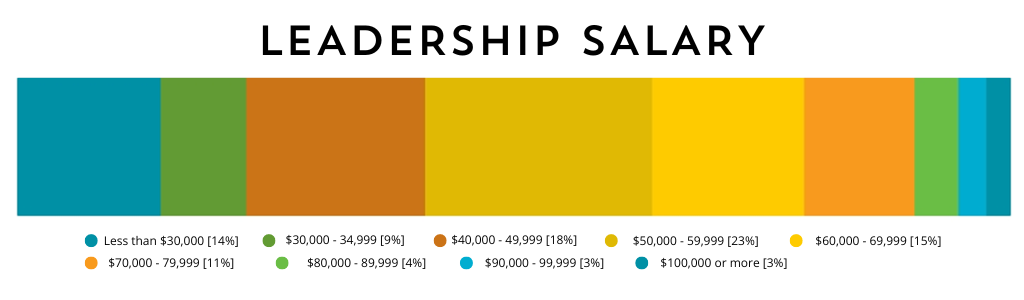
56 percent of local Main Street programs pay executive directors annual salaries between $40,000 and $70,000. 21 percent make more than $70,000, and 23 percent make less than $40,000. Highest Executive Director salaries are found in Washington, D.C., where all five Trends survey respondents (100%) earn more than $60,000 per year. Similarly high proportions of EDs earn $60,000 or more in California (80%), North Carolina (72%), and Colorado, Texas, and Washington (60% each).
Four benefits are offered to staff at most responding Main Street organizations: paid vacation and holidays (81%), paid sick leave (69%), professional development budgets and opportunities (66%), and medical insurance (50%). [Interested in seeing more data? The complete set of findings is available here.]
Characterizing Executive Directors
Based on the 367 respondents to the 2023 Trends survey, we can characterize Main Street executive directors in terms of their experience on the job, education, gender, and race and ethnicity.
Experience: On average, executive directors have about five years of experience in their current roles, but more than one in five (21%) EDs have been on the job in their current role for less than a year. Close to one in three (31%) have been in their role for less than two years. This may be the result of the COVID-19 pandemic, the “great resignation,” and the incredible pressure on Main Street leaders over the past few years that has led to burnout for many. At the other end of the spectrum, more than one in eight (13%) EDs have been in their role for more than 10 years.
Education: Most executive directors of local programs (51%) reported that a bachelor’s was their highest degree earned through formal education. 75 percent reported either a bachelor’s or master’s degree.
Gender: 79 percent of responding Main Street executive directors identify as women or females. 20 percent identify as men or males. 1 percent indicated that they preferred to not answer the gender question. Less than 1 percent identify as non-binary or transgender.
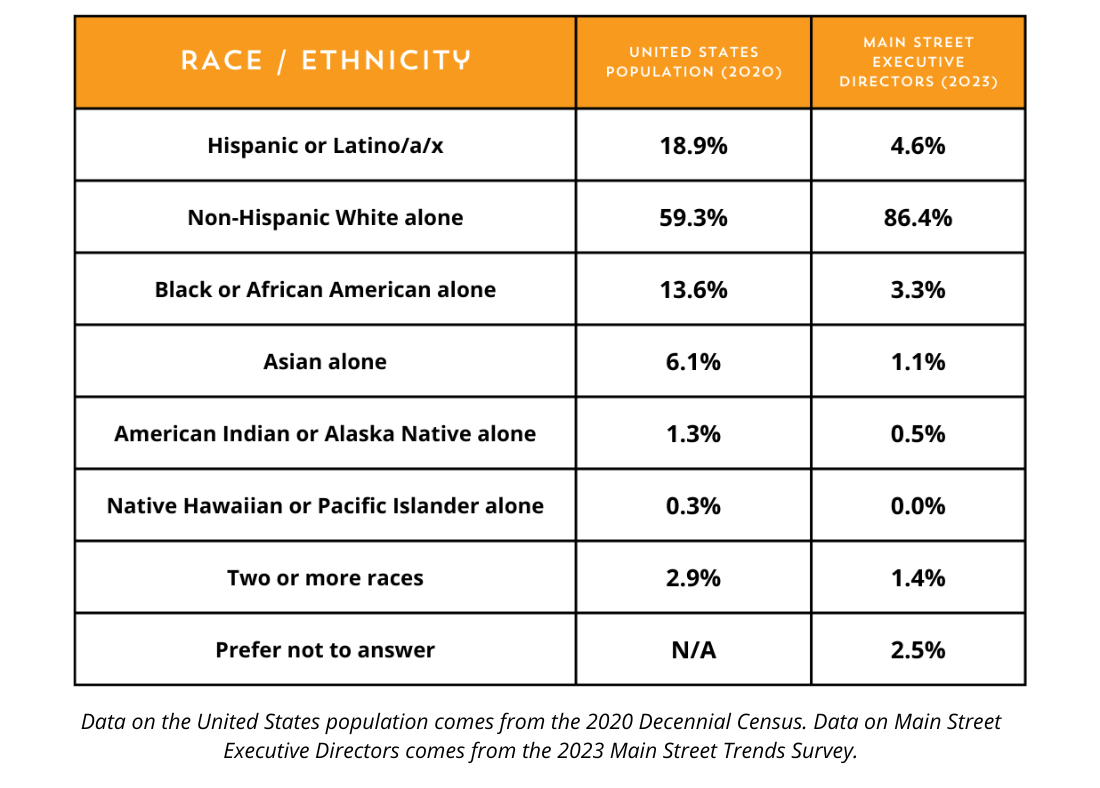
Race/Ethnicity: Compared to the United States population as a whole, Main Street executive directors are more often White or Caucasian and less often people of color. 86 percent of responding Main Street EDs identify as non-Hispanic White alone (not multiracial). In comparison, according to the 2020 U.S. Census, 59 percent of Americans identify as White alone and not Hispanic or Latino.
Who is Represented on Local Program Boards?
We have been hearing that board engagement is a rising priority for Main Street leaders, so in this year’s Trends survey, we asked about the makeup of local Main Street boards.
In terms of board members’ professional identities and stakeholder communities, we learned that most Main Street boards include business owners or industry representatives (98%), property owners (88%), city officials or elected officials (62%), downtown / district residents (62%), and senior citizens and retired people (59%). Non-native English speakers (9%), people with disabilities (8%), young people under the age of 18 (4%) are the three groups that are least well represented.
Meanwhile, we see much greater racial and ethnic diversity on Main Street boards in comparison to the racial and ethnic diversity of Main Street executive directors. 94 percent of respondents indicated that they have at least one White or Caucasian board member. Many Main Street boards include Black or African American board members (38%) and Hispanic or Latino/a/x board members (23%).
Outreach, Engagement, Diversity, Equity, Inclusion, and Accessibility
Multiple questions on the 2023 Trends survey focused on diversity, equity, inclusion, and accessibility (DEIA). These questions emerge from Main Street America’s commitment to advance DEIA in all our work and to grow a broader and more inclusive Main Street movement (as detailed in our strategic plan).
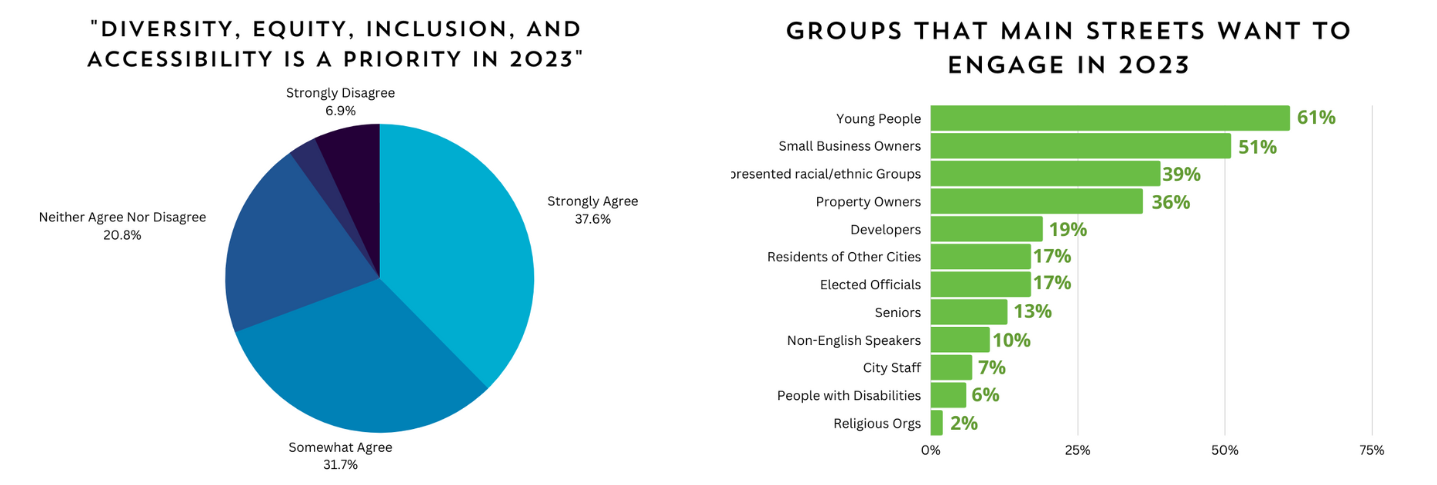
About 70 percent of survey respondents indicated they either somewhat agreed or strongly agreed that “improving the diversity, equity, inclusion, and accessibility of my program’s patrons, constituents, and programming is a priority in 2023.” Only 10 percent indicated disagreement with that statement. In the 2021 Trend Survey, 60 percent of respondents indicated that they had no goals or priorities related to diversity, equity, and inclusion. This growth in DEIA priorities is exciting.
We asked executive directors what groups they hoped to engage with more deeply in 2023. 61 percent of Main Street leaders indicated that youth and young people are a priority. Small business owners (51%) and property owners (36%) were frequently cited as priority groups. Engagement with underrepresented racial or ethnic groups is a priority for 39 percent of respondents.
To support deeper engagement with these groups, we asked what resources, trainings, and tools would be most helpful. 71 percent of Main Street executive directors indicated that training on how to best market to, attract, and engage with new groups would be useful. A peer-to-peer network with other Main Street programs with similar priorities (48%) and economic data about consumer spending (48%) were also cited as potentially useful resources for supporting engagement.
We also asked what the three most effective ways to market Main Street programs and their activities. Unsurprisingly, social media was cited by 94 percent of respondents as one of the top three marketing channels and by 78 percent as the single most effective channel for marketing. Program websites were the next most popularly cited marketing channel (57%). Print media also seems to be sneakily popular, as 39 percent of respondents cited it as one of their three most effective ways to market their program.
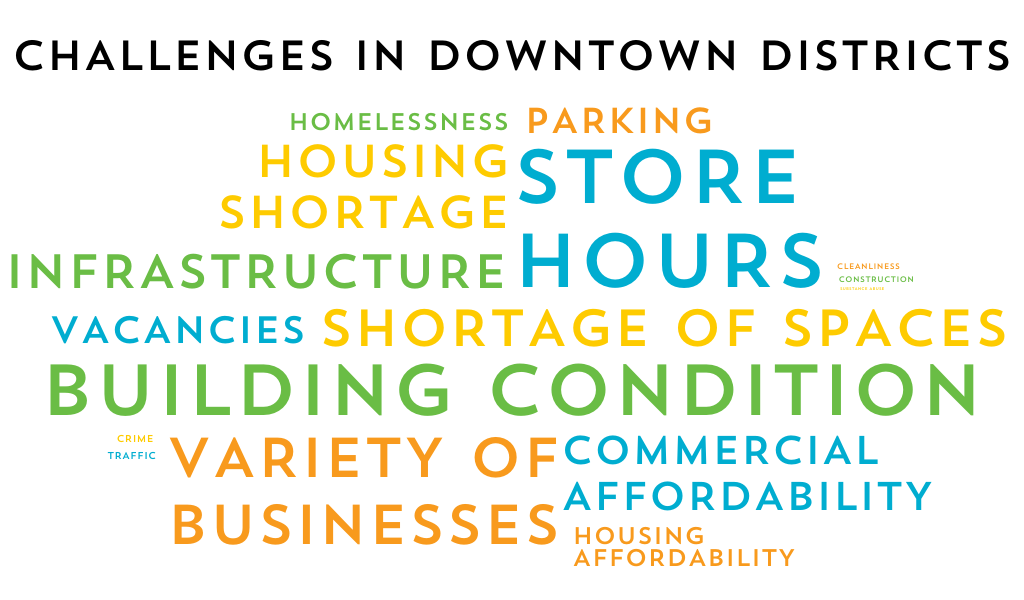
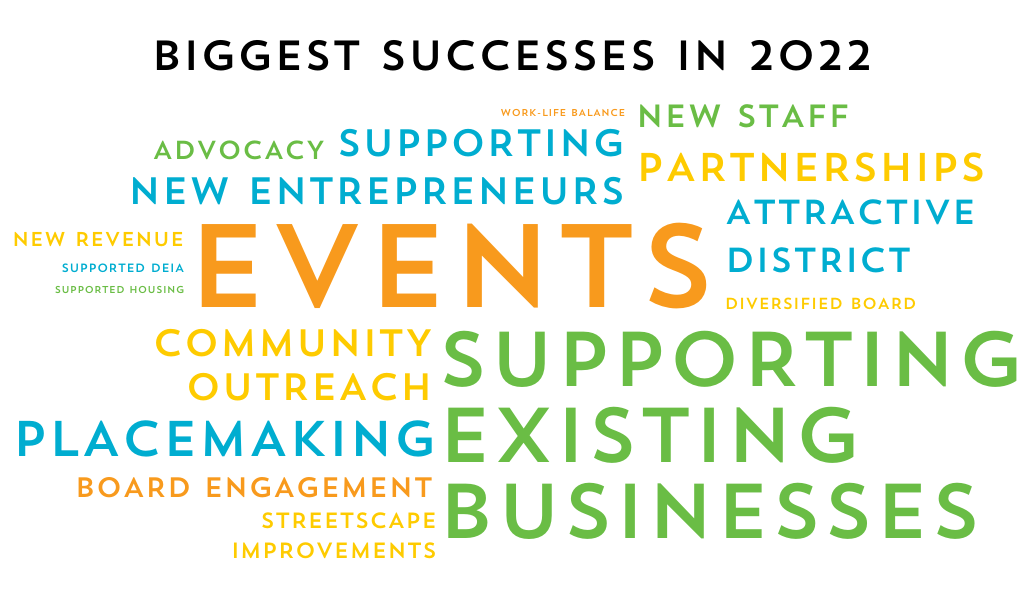
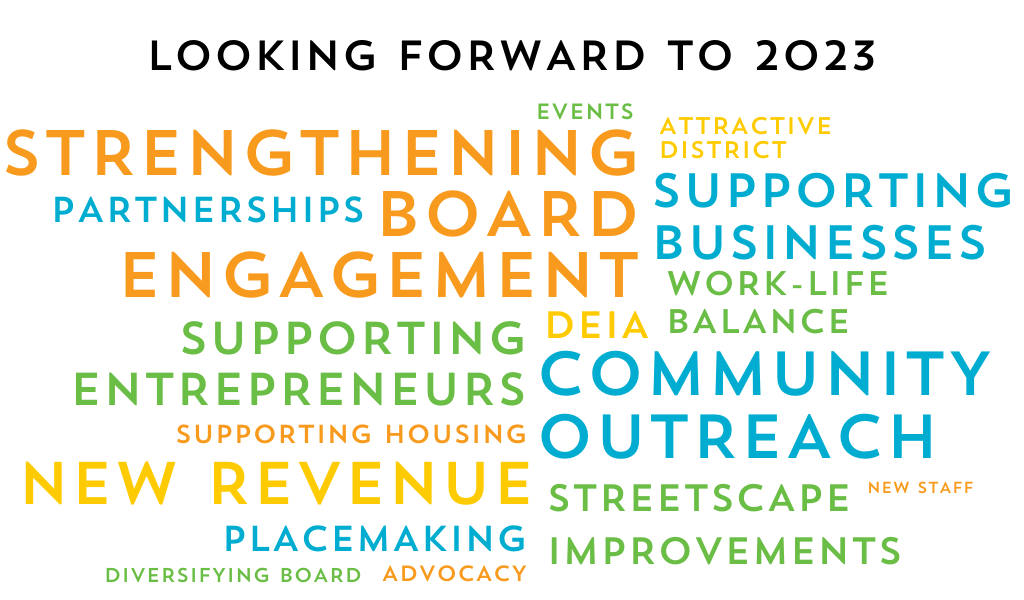
District Challenges and Program Strengths and Opportunities
In the survey’s final section, we asked about the top three challenges in the executive directors’ downtowns and neighborhood commercial districts, as well as the top three program successes in 2022 and top three areas for improved impact in 2023.
Survey respondents identified a wide spectrum of challenges in their downtowns and neighborhood commercial districts. Inconsistent or limited store hours (38%) and challenges with building maintenance and poor building condition (36%) were the two most often cited. Five other challenges were cited by at least one-fifth of the respondents, including business variety (28%), shortage of commercial spaces or storefronts (26%), challenges with infrastructure (24%), a shortage of housing (23%), and the affordability of commercial spaces and storefronts (20%).
Executive directors shared their pride in local programs’ greatest successes from 2022. Planning and hosting successful and popular events was more often cited than any other success by a wide margin (59%). Local programs touted their successful support of existing businesses (40%) and their support for placemaking and public art (25%). Beyond these top three successes, the survey results indicate a diversity of successes, but notably, diversifying the composition of programs’ boards (8%); supporting diversity, equity, inclusion, and accessibility (6%); supporting housing development (5%); and maintaining or improving the Executive Director’s own work-life balance (5%) were least often cited.
Since we launched this survey at the start of 2023, we were excited to hear from executive directors about the areas they were striving to improve their impact in the year ahead. Strengthening board engagement, noted as a top 2022 success by 14 percent of respondents on the prior question, was a top priority for 32 percent of respondents as they looked forward into 2023. Conducting successful community outreach and building community buy-in, noted as a 2022 success by 19 percent on the prior question, was a top priority for 31 percent of executive directors making plans for 2023. Housing development and support for DEIA also notably jump from lower rates of touted success in 2022 (as noted above) to higher priorities in 2023.
Clearly, the results of the 2023 Trends survey provide a lot of interesting insights into the actors and activities animating Main Street districts across the country. We appreciate the hundreds of executive directors who took time out of their busy schedules to respond to these questions. If the lengthy summary of the results provided in this blog post are only just starting to whet your appetite, you can see a complete PDF of the survey results here.
If you enjoyed reading through these findings, we are excited to have more data to report on soon. This week, we are kicking off our Winter 2023 Small Business Survey, and we need your help getting the word out. We would love to hear from small business owners and entrepreneurs in your downtowns, neighborhood commercial districts, and communities. Please be on the lookout for the survey link and distribution materials in upcoming editions of Main Street News. Thank you!
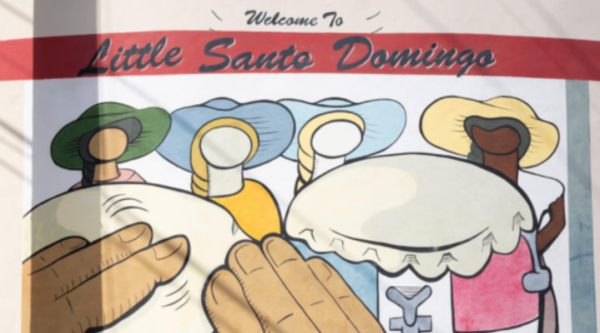
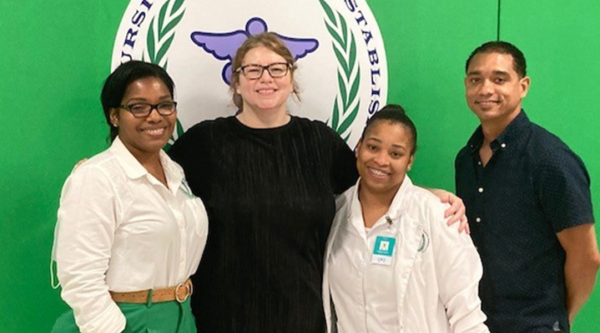
Urban Impact Inc., harnesses strategic investments and collaborative efforts to foster a vibrant and sustainable future, from visionary adaptive reuse ventures to transformative development grants for small businesses and property owners in Birmingham, Alabama's historic 4th Avenue Black Business District.
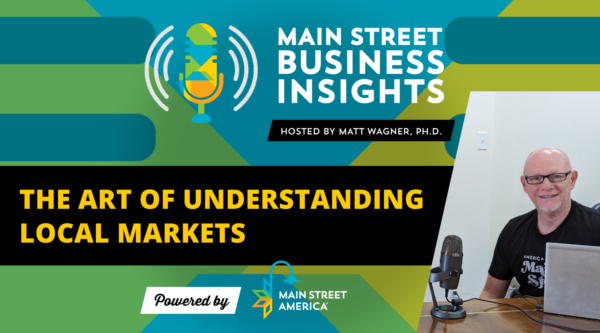
In the last episode of season two of Main Street Business Insights, tune in as host Matt Wagner breaks down how to understand and synthesize local market data.
Sterling Main Street launched a brick and mortar retail incubator spaces. Executive Director Janna Groharing shares lessons they learned about organization, fundraising, and outreach.
In this episode of Main Street Business Insights, Matt sits down with Glen Ellis, owner of Sycamore Education, Dominion Catalyst Services, and Milady Coffeehouse in Fremont, Nebraska.
In this episode of Main Street Business Insights, Matt sits down with Jaime Courtney, President of Shoalwater Seafood, Derek King, Oyster Farm Director of Shoalwater Seafood, and Shane Thomas, Tribal Council Vice Chair of the Shoalwater Bay Indian Tribe.
Sarah Cole, owner of Abadir’s in Greensboro, Ala., was a 2023 Backing Small Businesses grantee. Abadir’s is a pop-up eatery specializing in seasonal and wholesome baked goods influenced by Egyptian traditions and flavors combined with inspiration from true Southern cuisine.
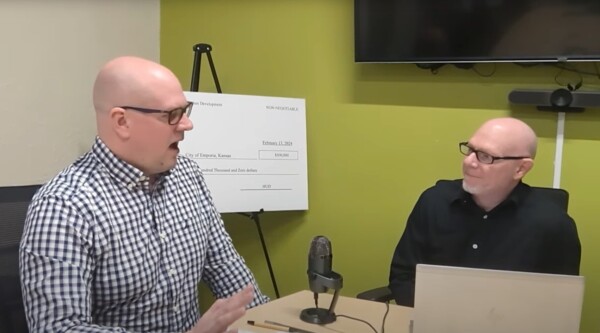
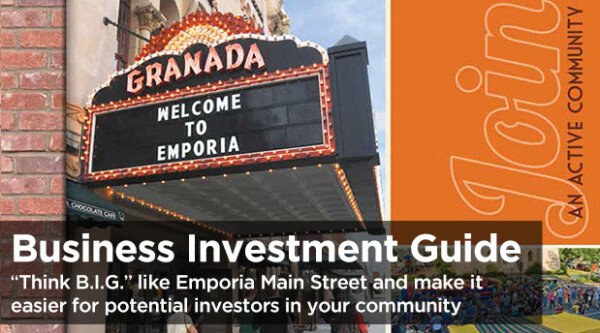
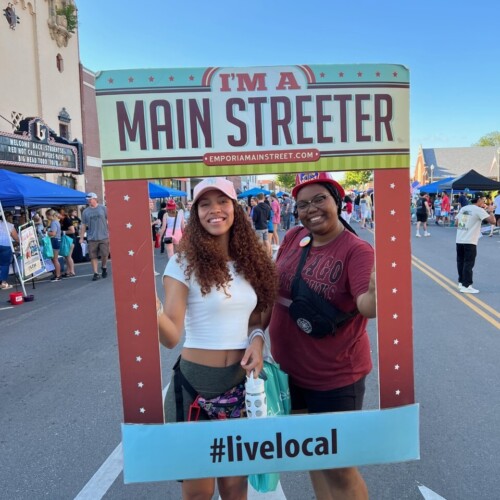
In this episode of the Main Street Business Insights podcast, Matt sits down with Casey Woods, Executive Director of Emporia Main Street in Emporia, Kansas.
In this episode of Main Street Business Insights, Matt sits down with Nicole Fleetwood and McKinzie Hodges, co-owners of Scratch Made Bakery in Amarillo, Texas.
Tylisya Gober, owner of Barbie Behavior Boutique in Oak Park, Mich., was a 2023 Backing Small Businesses grantee. Barbie Behavior is a women’s clothing boutique specializing in celebrity-inspired attire.
Tiffany Fixter, owner of Brewability in Englewood, Colorado, was a 2023 Backing Small Businesses grantee. Brewability is an inclusive brewery and pizzeria that employs adults with disabilities to brew craft beer.
We’re excited to announce that Main Street America will continue to offer virtual and on-demand small business training in 2024 through an evolved program, the Small Biz Digital Trainers program.
In this episode of Main Street Business Insights, Matt sits down with Tiffany Fixter, owner of Brewability, an inclusive craft brewery and pizzeria that employs adults with disabilities based in Englewood,
In this episode of Main Street Business Insights, Matt sits down with Jennifer Jones, co-owner of Good Times Coal Fired Pizza and Pub in Big Stone Gap, Virginia.
In this episode of Main Street Business Insights, Matt sits down with Bobby Boone, founder and Chief Strategist of &Access. Based in New Orleans, La., &Access creates data-driven and design-centric retail real estate solutions for historically excluded entrepreneurs and under-invested neighborhoods.
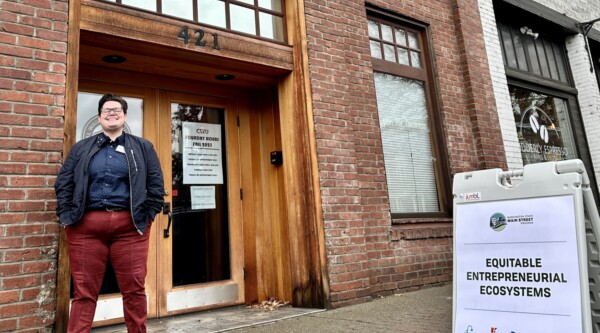
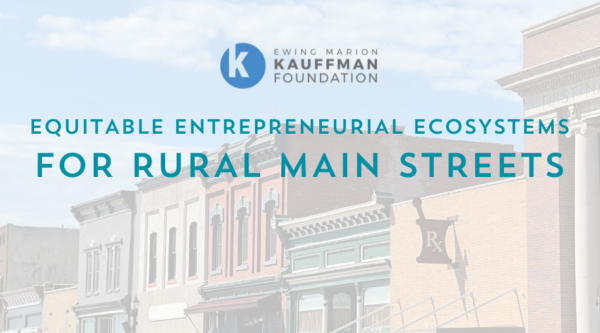
Tasha Sams, Manager of Education Programs, shares highlights of phase one of the Equitable Entrepreneurial Ecosystems (E3) in Rural Main Streets Program and the biggest takeaways from the workshop experiences.
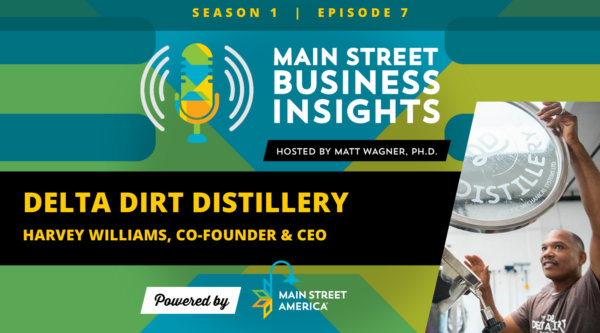
In this video, learn more about the Williams’ family story, how the business is helping to revive downtown Helena, and the impact they’re having on a national level.
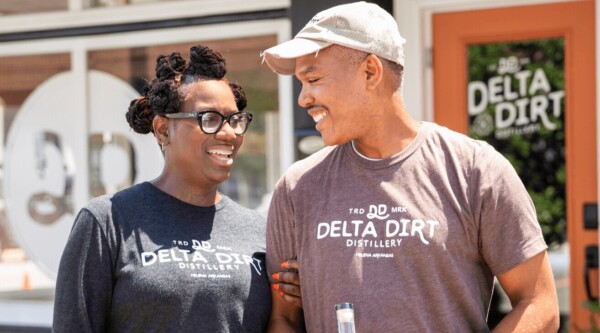
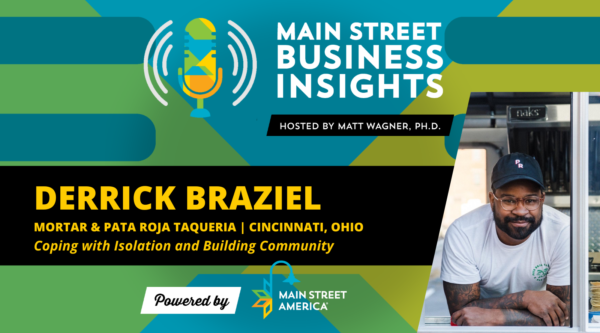
In this episode of Main Street Business Insights, Matt sits down with Derrick Braziel, owner of Pata Roja Taqueria and co-founder of MORTAR, in Cincinnati, Ohio.
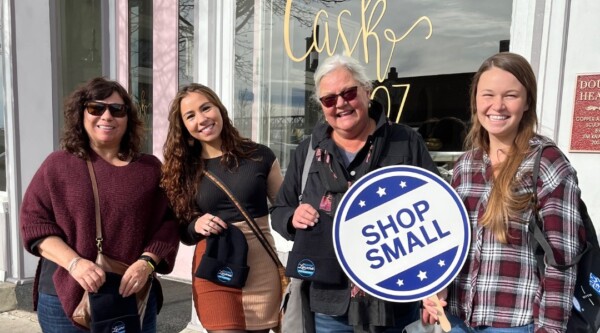
Small Business Saturday is an important opportunity to show your support for local businesses. We asked business owners across the network what your support means to them.
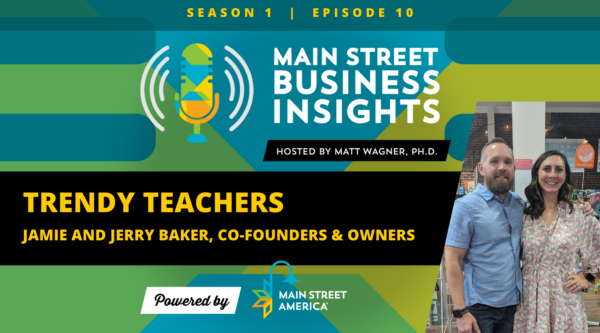
Matt sits down with Jamie and Jerry Baker, co-owners and founders of Trendy Teachers, a teaching boutique and educational toy store located in downtown Rome, Georgia.
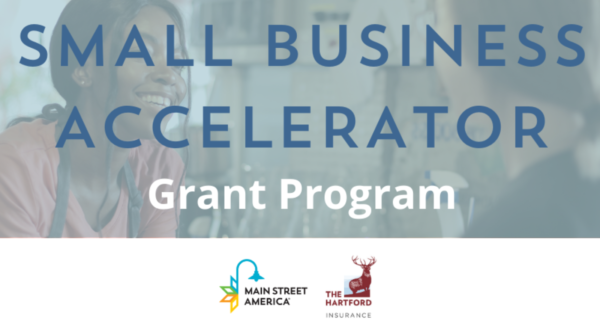
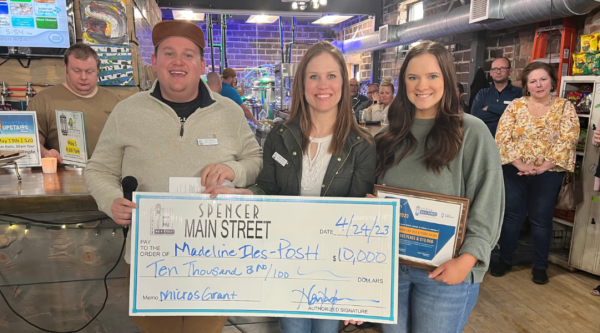
Middlesboro Main Street in Middlesboro, Ky., Puerto Rican Cultural Center in Chicago, Ill., and Sugar Creek Business Association in Charlotte, N.C., have each been awarded $100,000 through The Hartford Small Business Accelerator Grant Program in partnership with Main Street America.
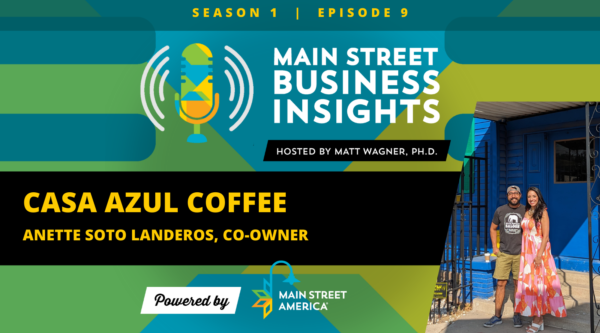
Matt sat down with Anette Soto Landeros, co-owner of Casa Azul Coffee and President and CEO of the Fort Worth Hispanic Chamber of Commerce in Fort Worth, Texas.
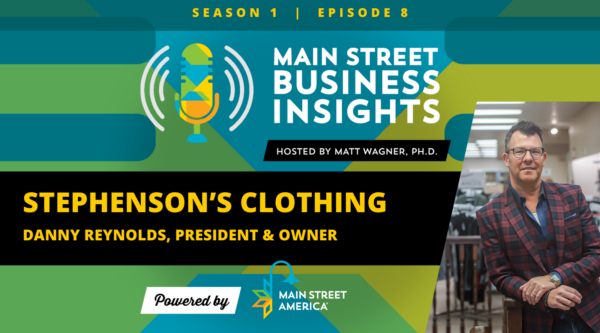
Matt Wagner sat down with Danny Reynolds, president and owner of Stephenson's, an independently owned high-end fashion retailer in downtown Elkhart, Indiana.
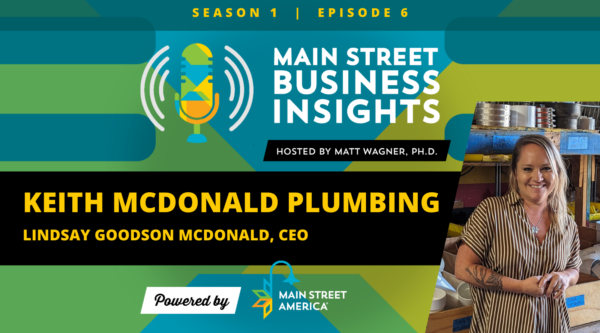
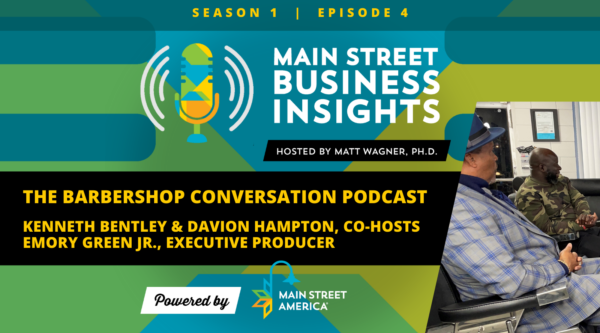
Matt Wagner sat down with The Barbershop Conversation podcast team, co-hosts Kenneth Bentley and Davion Hampton along with executive producer Emory Green Jr., in Goldsboro, Florida.
This three-week live, online course will prepare local leaders to more effectively work with small business owners in their districts and create an environment that is supportive of entrepreneurship.
Meet the 2023 recipients for the Backing Small Businesses grant program, presented by American Express, to provide financial support to small business owners to address critical needs and make a positive impact in their local communities.
In partnership with Grow with Google, our digital coaches will work with businesses in their home states, with a focus on those that operate in small towns and rural communities.
Check out a deep dive into the results of our Spring 2023 Small Business Survey, plus insights to help inform the work of local leaders supporting entrepreneurs on Main Street.
Matt Wagner wrote an article for the OECD blog on how can small business owners can combine digital tools with the power of place to find sustainable success.
Inspired by a session at the 2022 Main Street Now Conference, Main Street Ottumwa has launched the Business Builder Academy, an entrepreneurship course to help aspiring business owners start their ventures.
Whether you are a seasoned American Express Small Business Saturday Neighborhood Champion or an entrepreneur joining this national movement for the first time, we’ve gathered a roundup of resources to support your “shop local” marketing efforts.
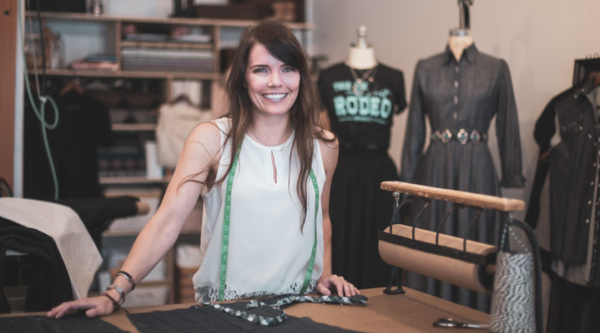
We spoke to three women who were awarded Inclusive Backing grants to learn more about their passions, their businesses, and their advice for other women.
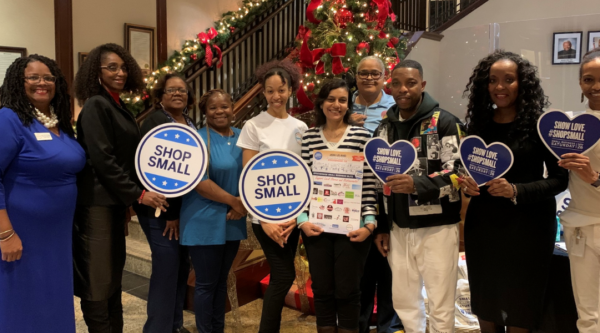
From social media scavenger hunts to downtown passports, the Main Street network has used countless innovative ways to encourage their communities to Shop Small®—and had plenty of fun doing it.
#EquityRising, Old Algiers Main Street Corporation's new job training program, seeks to combat rising cost of living by helping residents train for careers that will allow them to stay in their neighborhood.
We spoke to three Black business owners who were awarded Backing Small Businesses grants from Main Street America and American Express to better understand their challenges, successes, and the kinds of support that have helped them the most.
Main Street Skowhegan opened their new Skowhegan Center for Entrepreneurship, a downtown space for co-working, meeting, entrepreneurial support, trainings, and education.
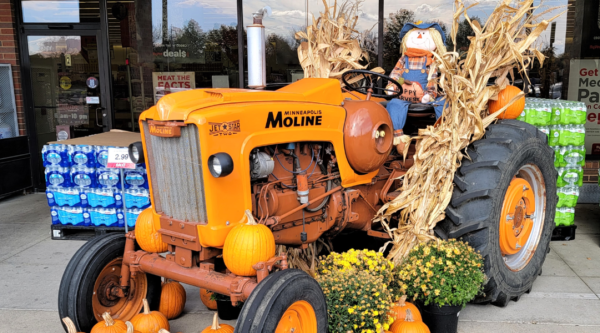
Main Street Charles City organizes their annual 'WonderFall' event, a business decorating contest designed to have some fun with the autumnal season as well as provide a reminder of the importance of curb appeal in attracting the public’s attention.
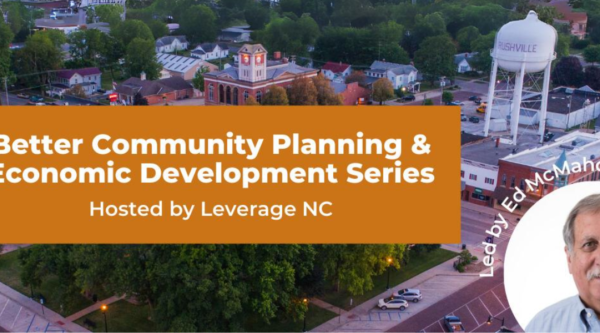
Leverage NC, a partnership between North Carolina Main Street and the North Carolina League of Municipalities, hosted a four-part webinar series titled Better Community Planning & Economic Development led by Ed McMahon, Chair Emeritus of Main Street America and a leading national authority on land use policy and economic development.
Main Street Arkansas has brewed a new engaging way for tourists and residents alike to explore local Arkansas commercial districts: the Main Street Arkansas Coffee Trail.
We spoke with two Black entrepreneurs in UrbanMain commercial districts: L. May Creations in the Austin neighborhood of Chicago and The Four Way in south Memphis, Tennessee.
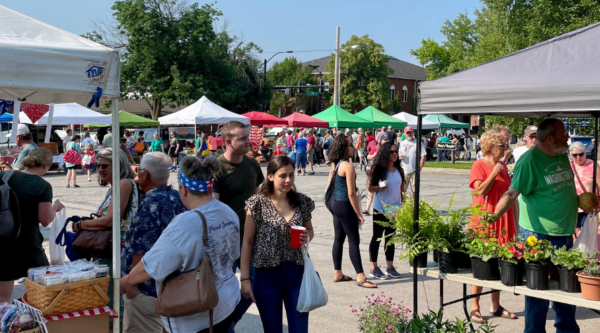
We heard from organizations across the nation about the incredible impact their markets have had on community engagement, entrepreneur and small business support, and keeping their district vibrant.
The global pandemic gave us all a glimpse of a further dispersed future – a time when you don’t sit in a classroom at school, watch movies in a theater, or even go to the grocery store. Where do Main Streets fit in that model?
This May marked the 100th anniversary of the Tulsa Race Massacre in the Greenwood neighborhood of Tulsa, Oklahoma. We explored the impact and legacy of this tragic event.
BDOs are place-based organizations that help small businesses and entrepreneurs to flourish. They have been on the frontline of support for the country’s hardest-hit entrepreneurs throughout the pandemic and have been working to enable thriving commercial corridors throughout the crisis.
Matthew Wagner, Ph.D., Chief Program Officer at Main Street America, was featured on Breaking Down Barriers: a podcast from Startup Space highlighting stories of community leaders who break down barriers to entry for underserved and unrepresented entrepreneurs.
We heard from 289 business owners in 35 states plus the District of Columbia in our new text message-based survey of small business owners across the network.
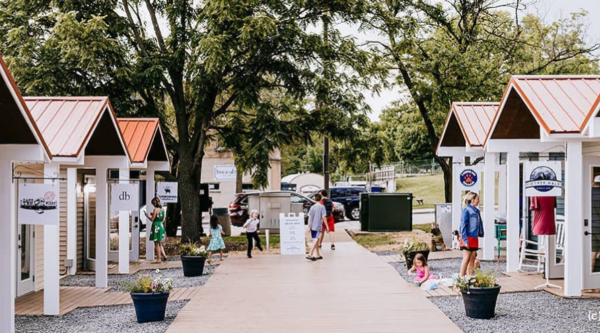
The Batavia Boardwalk Shops are freestanding, purpose-built structures acting as seasonal pop-up locations for entrepreneurs, offered in tandem with a business incubator program.
For Black History Month, we want to recognize and celebrate the Black business owners and entrepreneurs who have overcome challenges and obstacles in launching and running their own businesses, thanks to resilience, creativity, and hard work.
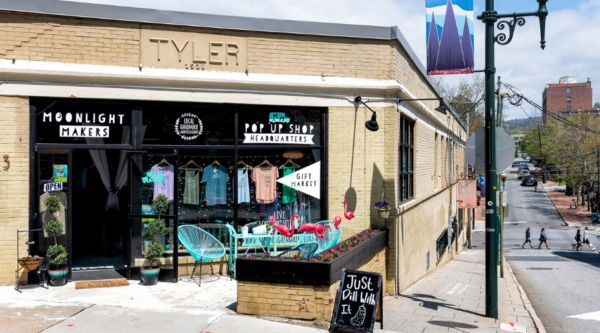
As a vital place factor within an entrepreneurship ecosystem, pop-up programs allow for emerging businesses to test their product, gain consumer feedback, and promote their brand at an extremely low cost. In essence, allowing for a ‘fail-fast’ product development cycle.
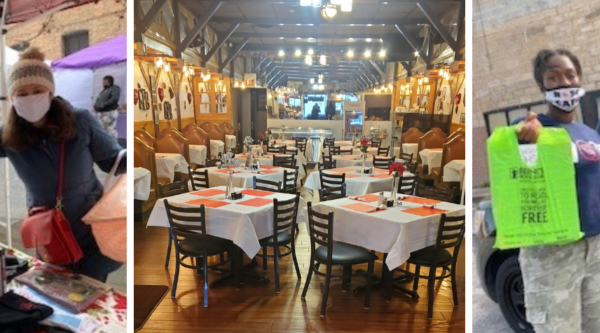
In early December, as the COVID-19 crisis intersected with a peak moment in the holiday shopping season, we surveyed small business owners and Main Street programs to learn more about how they were managing.
New research by Main Street America suggests greater returns on our missions and resources can be had by transitioning to more deliberate economic vitality work centered on cultivating new business development from within our own communities and neighborhoods.
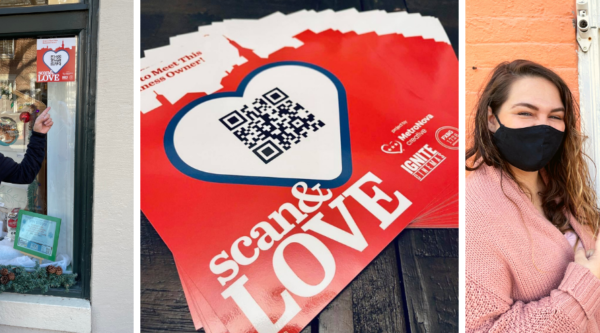
Fredericksburg Virginia Main Street (FVMS) is taking storefront activation to a new level with their new initiative, the Scan & Love Project, which tells the stories of business owners through personal and engaging videos.
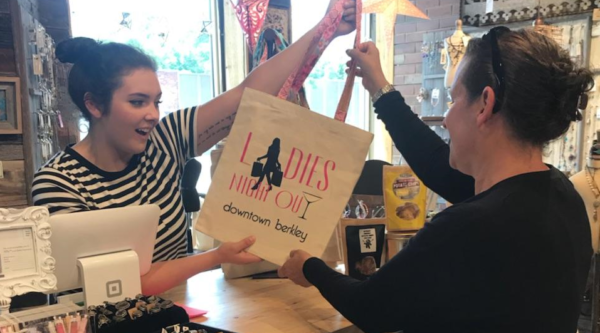
The Berkley Downtown Development Authority (DDA) proudly debuted its Downtown Berkley Shopping Bag for a Cause through a partnership between Better Life Bags.
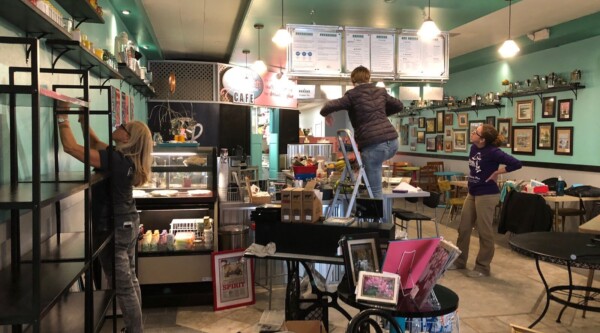
Supporting new and existing small businesses, and the entrepreneurs who run them, represents a vital aspect of the revitalization of downtowns and neighborhood business districts.
The Equitable Economic Development Fellowship is a two-year, one million-dollar effort funded by the Surdna Foundation and the Open Society Foundations to help equity, transparency, sustainability and community engagement become driving forces in local economic development efforts.
The Jefferson Rotary Club partnered with Jefferson Matters: Main Street to offer mini-grants for building facades and storefront signage to two dozen businesses for up to $500 each.
The Wisconsin Economic Development Corporation (WEDC) partnered with Retailworks, Inc., a commercial interior design, display and branding firm headquartered in Milwaukee, to launch Wisconsin’s Main Street Makeover Contest.
Too often, as we’re strolling our favorite Main Street, we pass empty or dark shop windows that make us want to hurry home a little bit faster. Imagine instead, a charming streetscape adorned with vibrant, lively window displays, showcasing retailers’ favorite products and seasonal gift ideas.
Small Business Saturday promo pic from Downtown Goldsboro, North Carolina, showing all the folks who took the pledge support a small business in their community.
We’ve put together a practical list of some of the things that local store owners can do right now to help them capitalize on this increasing trend in local searches.
From authentic comfort food to farm-to-fork fresh and everything in between, these restaurants, bars, and cafes are key to the thriving social, business, and residential life in the historic commercial districts in Main Street Iowa communities.
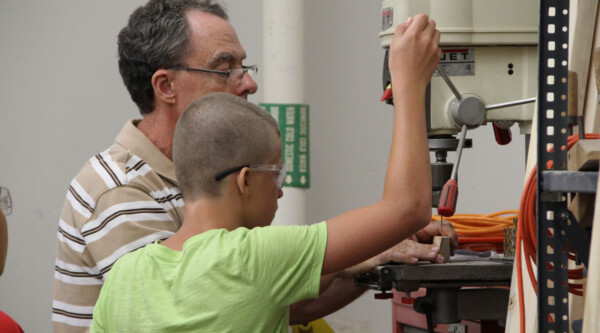
Located in southeast Kansas, Independence (pop.8,799) is home to Fab Lab ICC, which is on track to be the world’s leading innovator in combining entrepreneurial mindset education with a fab lab maker space.
Being the only person in the know can be fun, exhilarating even. Except when you are the one person out of 600+ in a room and you know bad news is coming.
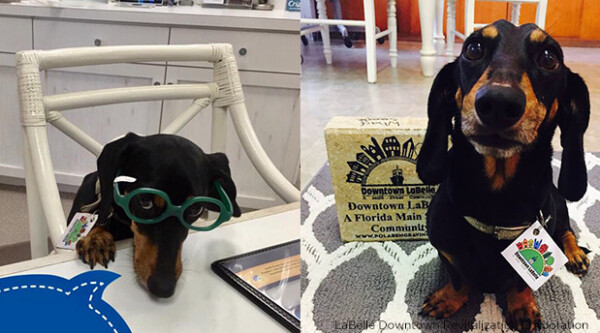
Fritz the dog has made his way into the hearts of the residents of LaBelle, Florida, and helped our Main Street Community find a way to make what we do more noticeable.
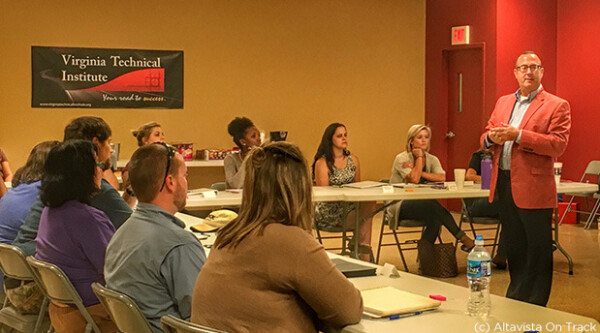
Altavista On Track, the local Main Street organization, is working to cultivate and sustain local entrepreneurs with an educational business launch competition, Pop-Up Altavista 2.0.
The first rule of conducting business is “make it simple.” The easier it is to pay for merchandise, get entertainment or obtain a service, the more likely it is that people will take advantage of those options.
Main Street communities across the country are no stranger to seeking creative strategies to solve their most nagging issues – vacant buildings, marketing downtown, bolstering retail to name a few.
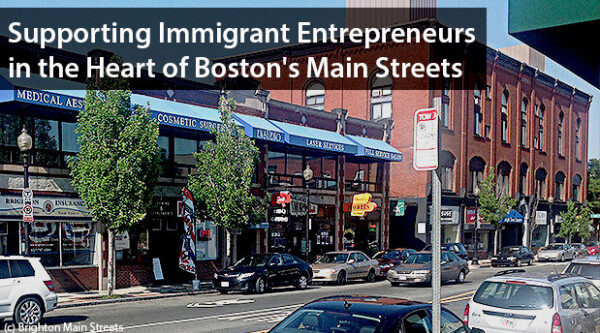
To understand the role that immigrant business owners play in Boston’s small business ecosystem, you need only to walk through any Boston Main Streets district.
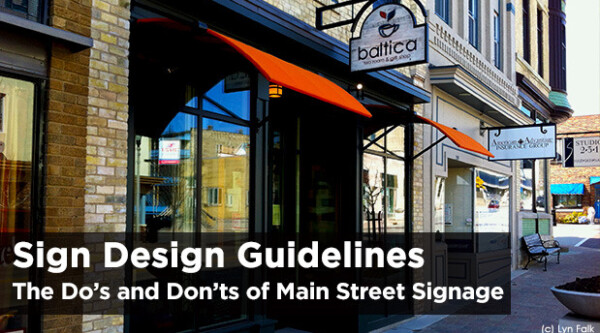
A lot of signs are necessary to make a downtown work well, but not every community knows what a good sign system looks like, or how instrumental it can be to the creation of a successful downtown.
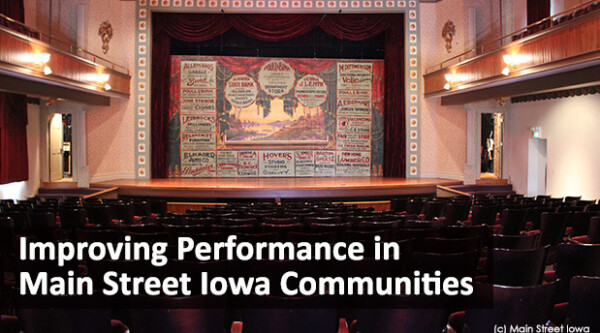
Main Street Iowa, a program of the Iowa Economic Development Authority’s Iowa Downtown Resource Center, created a one-of-a-kind three-year program to provide help for performance venues located in Main Street districts.
 Experience: On average, executive directors have about five years of experience in their current roles, but more than one in five (21%) EDs have been on the job in their current role for less than a year. Close to one in three (31%) have been in their role for less than two years. This may be the result of the COVID-19 pandemic, the “great resignation,” and the incredible pressure on Main Street leaders over the past few years that has led to burnout for many. At the other end of the spectrum, more than one in eight (13%) EDs have been in their role for more than 10 years.
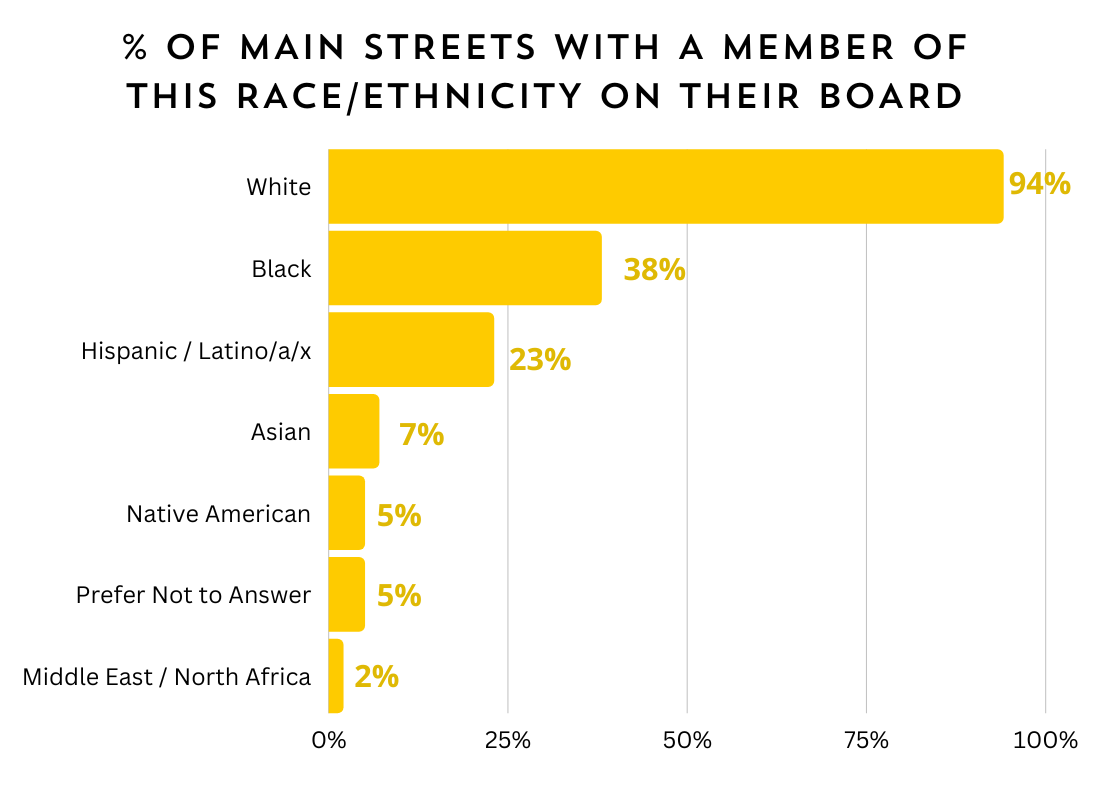
.png)